Bestseller
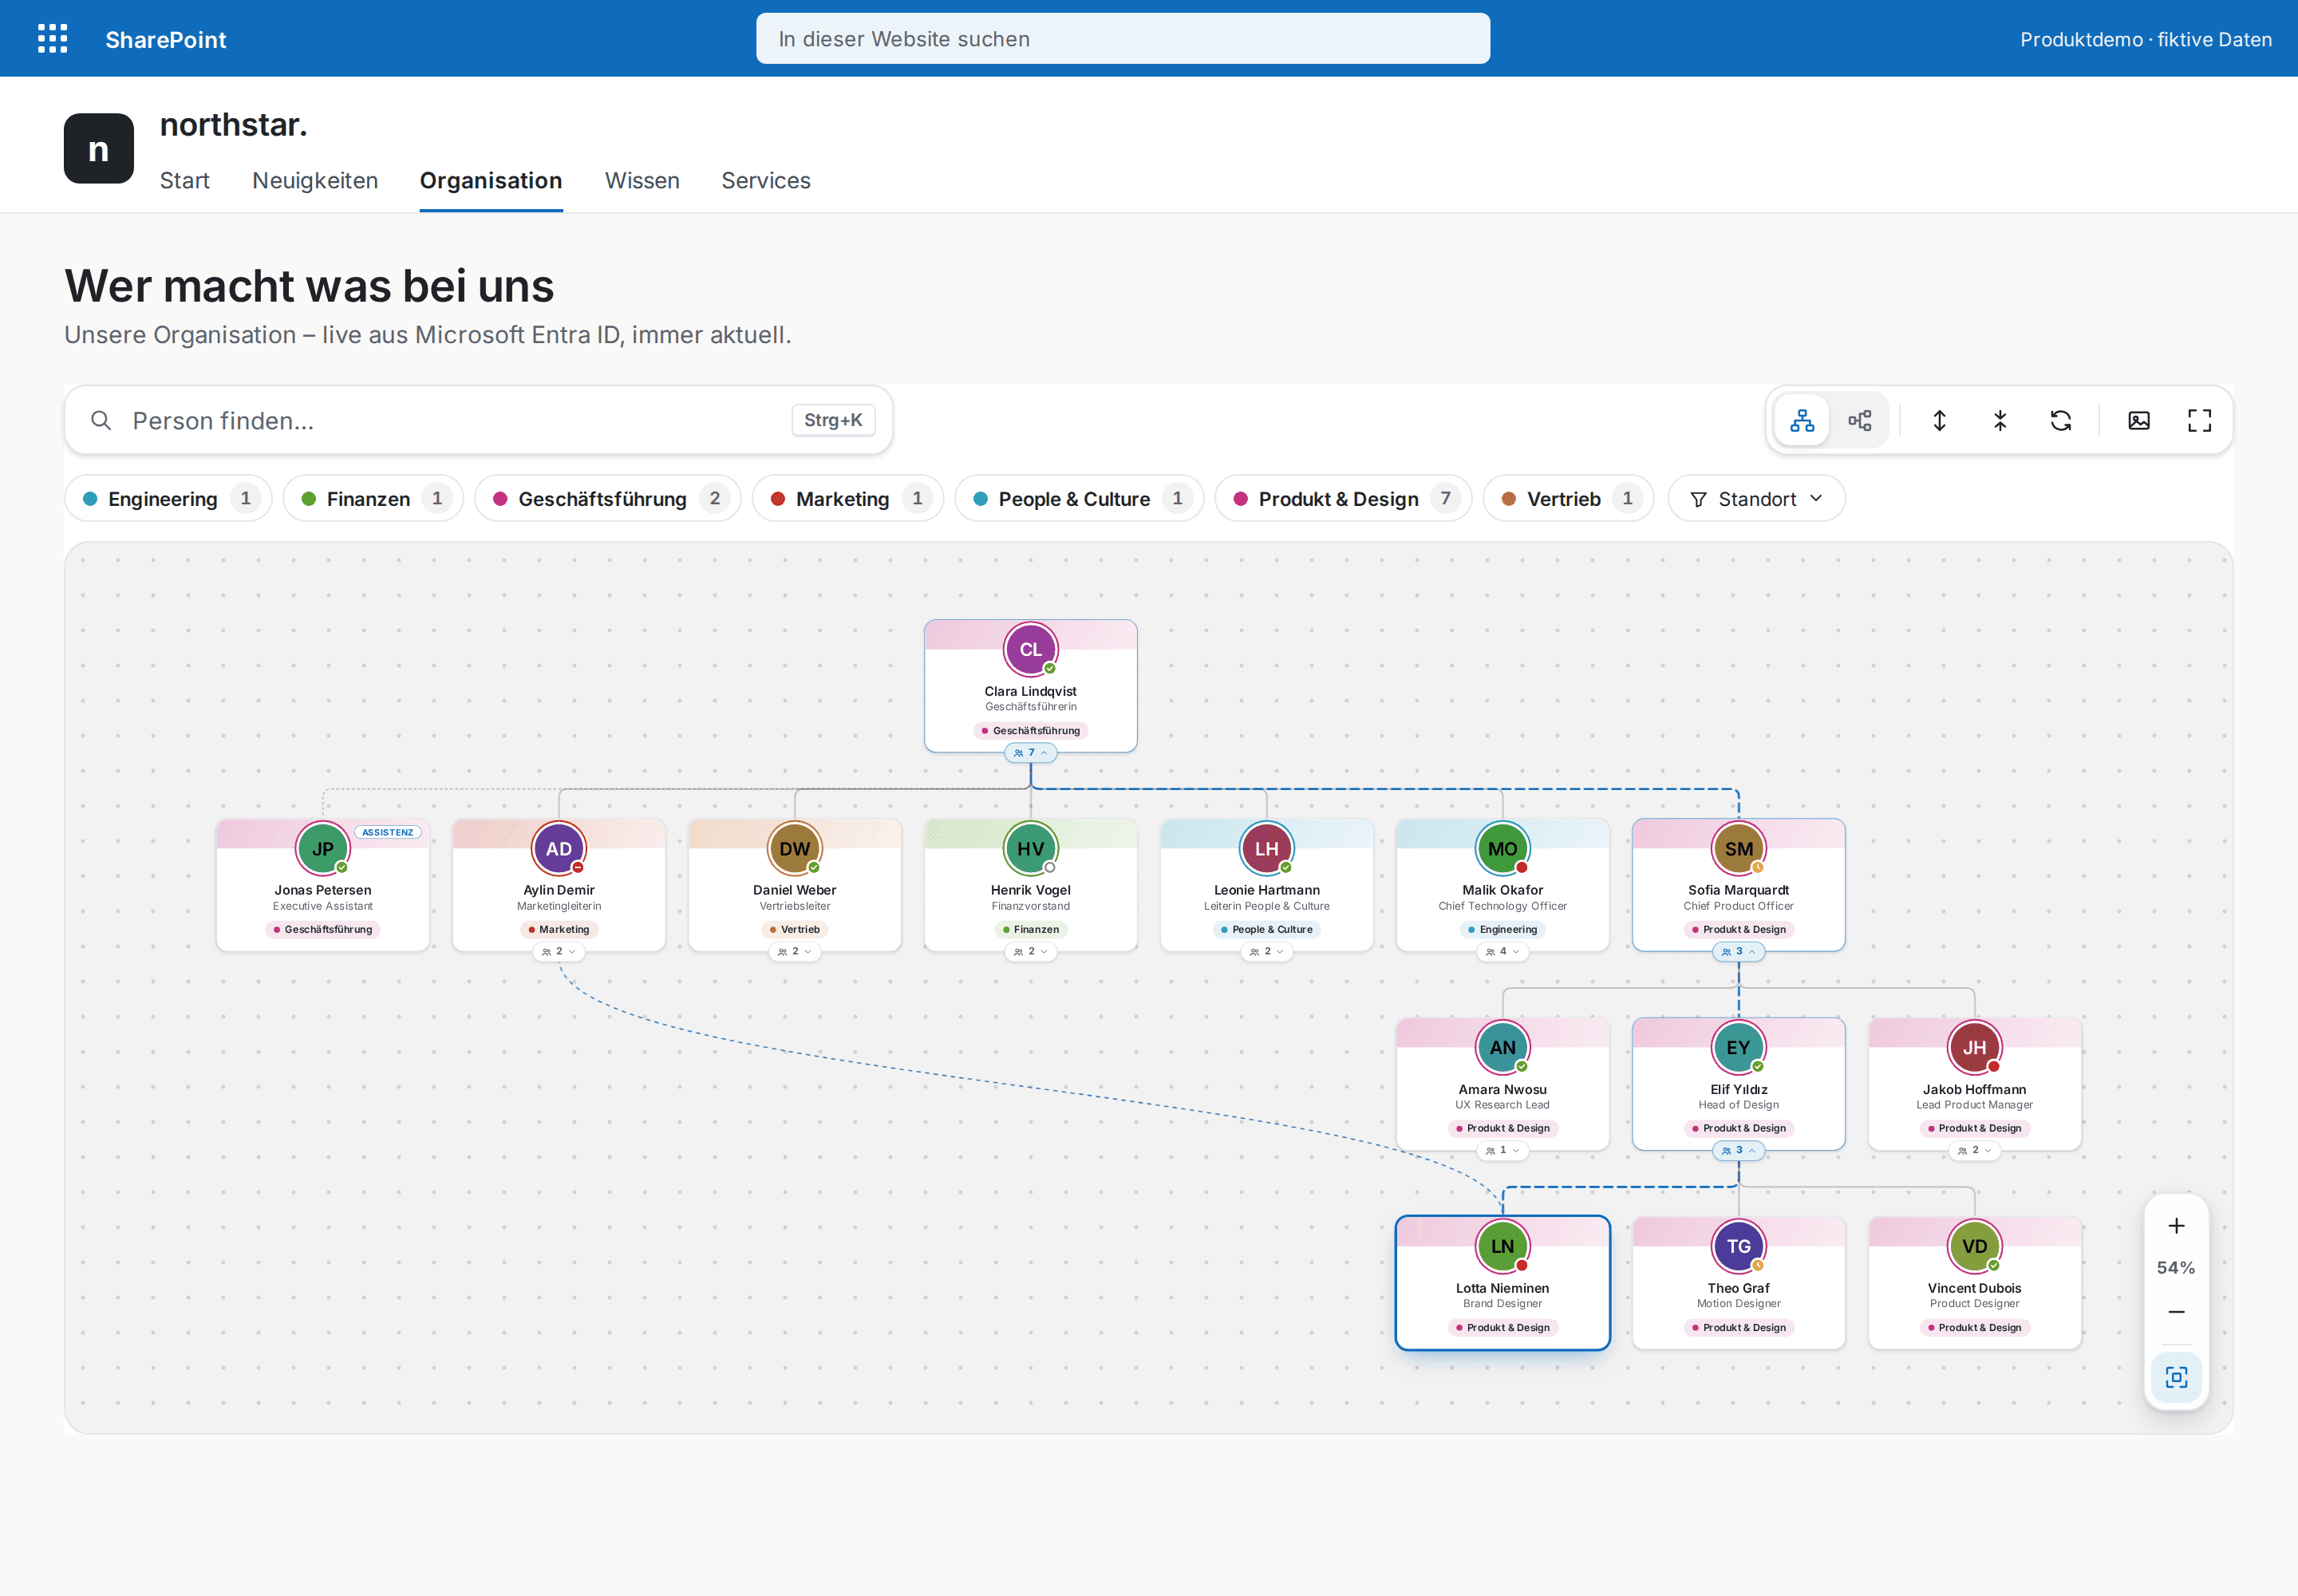
HR & People
Org Chart Pro
The modern org chart straight from Microsoft Entra ID — always current, zero maintenance.
€1,290
B2B store: sales exclusively to businesses, public-law entities and special funds under public law. Prices are net plus applicable taxes.
Analytics
NewLive KPI cards from SharePoint lists — targets, thresholds, trends and sparklines without Power BI licences or API permissions.
KPI Dashboard Pro turns the lists your teams already maintain into a management cockpit on any modern SharePoint page. Each KPI counts, sums or averages the items of a list, takes the minimum, maximum or latest value of a number column, and can be limited to a day, week, month, quarter or year with a structured filter condition — no Power BI licence, no export, no custom code.
Every card shows the current value with unit and number format, a trend against the previous value or period, a sparkline of the recent development, progress toward a target and a status chip driven by warning and critical thresholds in either direction. Status always combines an icon with text, so it never relies on colour alone.
Authors configure everything in a Fluent UI editor launched from the property pane: pick a list, choose its columns from real dropdowns, set calculation, period, scope, filter, format and thresholds, then order, duplicate or hide KPIs. Figures that are maintained by hand — survey results, headcount, budgets — fit in as KPIs with an authored value, previous value and history.
New in version 1.1: status chips above the dashboard count the KPIs on track, needing attention and critical and filter with one click, combined with the group filter. Hovering a sparkline shows the value of each period. “Lower is better” targets read “Target met” or the distance (“57 above target”) instead of a misleading percentage. Lists above 5,000 items work without indexes: when SharePoint rejects a query because of the list view threshold, the web part reads the newest items by the indexed ID and filters in the browser.
The dashboard follows light and dark SharePoint sections with Theme, Soft and Compact skins, offers cards or rows in two to six columns, group filter chips and group headings, a refresh button with optional automatic refresh, and is localized in English and German. It reads lists through SharePoint REST under the signed-in user's permissions: no Microsoft Graph or other API approval, no external service, no telemetry. KPI Dashboard Pro is developed and published by Lyron.
This is a ready-made SPFx web part for SharePoint Online. What SPFx web parts are · Install the .sppkg · All web parts · Tenant licensing and updates
| Version | 1.1.0 |
|---|---|
| Last updated | Sep 24, 2026 |
| SPFx version | ≥ 1.23.2 |
| SharePoint Online | Yes |
| Microsoft Teams | No |
| SharePoint on-premises | No |
Any non-hidden list of the current site or another site in the same tenant (custom lists, issue tracking, tasks). Values come from number, currency, integer or calculated number columns, periods from date columns (Created and Modified are always available), and filters use text, choice, number, date or yes/no columns. Document libraries are not offered in version 1.1.0.
No. The web part reads exclusively through SharePoint REST under the signed-in user's permissions and writes nothing. It requests no Microsoft Graph or other API permission, uses no external service and contains no telemetry. Readers only see figures from lists they are allowed to read themselves.
With a date column and a period, items are bucketed per day, week, month, quarter or year. With “current period” the card shows the running period and the previous period drives the trend; with “all items” everything counts and the sparkline shows the per-period development. For “latest value” the most recent entries form the history. Maintained figures bring value, previous value and history themselves.
Per KPI you choose the direction (higher or lower is better). For “higher is better” the target produces the progress bar with the ratio, for example “84 % of target”. For “lower is better” the card reads “Target met” at or below the target and otherwise the distance, for example “57 above target”, with a bar that shrinks the further the value is from the target. Warning and critical thresholds decide the status: below (or above) the warning threshold “Attention”, below (above) the critical threshold “Critical”, otherwise “On track”; the editor warns when the two are in the wrong order. Without thresholds a met target counts as “On track”; without either, no chip is shown.
Each KPI reads 200 to 5,000 items (default 2,000) in pages of 1,000. Period-scoped KPIs automatically bound the request to the history window and “latest value” reads a single page of the most recent entries. When a list holds more than 5,000 items and a filter or sort column is not indexed, SharePoint rejects the query; the web part then switches automatically to a threshold-safe read of the newest items by the indexed ID and applies the filter in the browser. When the item limit is reached, a notice marks the affected KPIs. Indexing the date and filter columns keeps the exact, server-side path.
Yes. A KPI with the source “maintained figures” takes a current value, an optional previous value and a history such as “12; 14.5; 18”. It gets the same targets, thresholds, formats and presentation as a list KPI. Three such sample KPIs start with the web part so the page shows something immediately.
On modern SharePoint Online pages and in the SharePoint full-page host with SPFx 1.23.2 or newer. Microsoft Teams and SharePoint Server on-premises are not claimed for version 1.1.0.
Lyron is the developer and publisher. The one-time licence covers one Microsoft 365 tenant with unlimited authorised users and pages; after release, delivery uses SPFxStore’s protected licence and download flow.
HR & People
The modern org chart straight from Microsoft Entra ID — always current, zero maintenance.
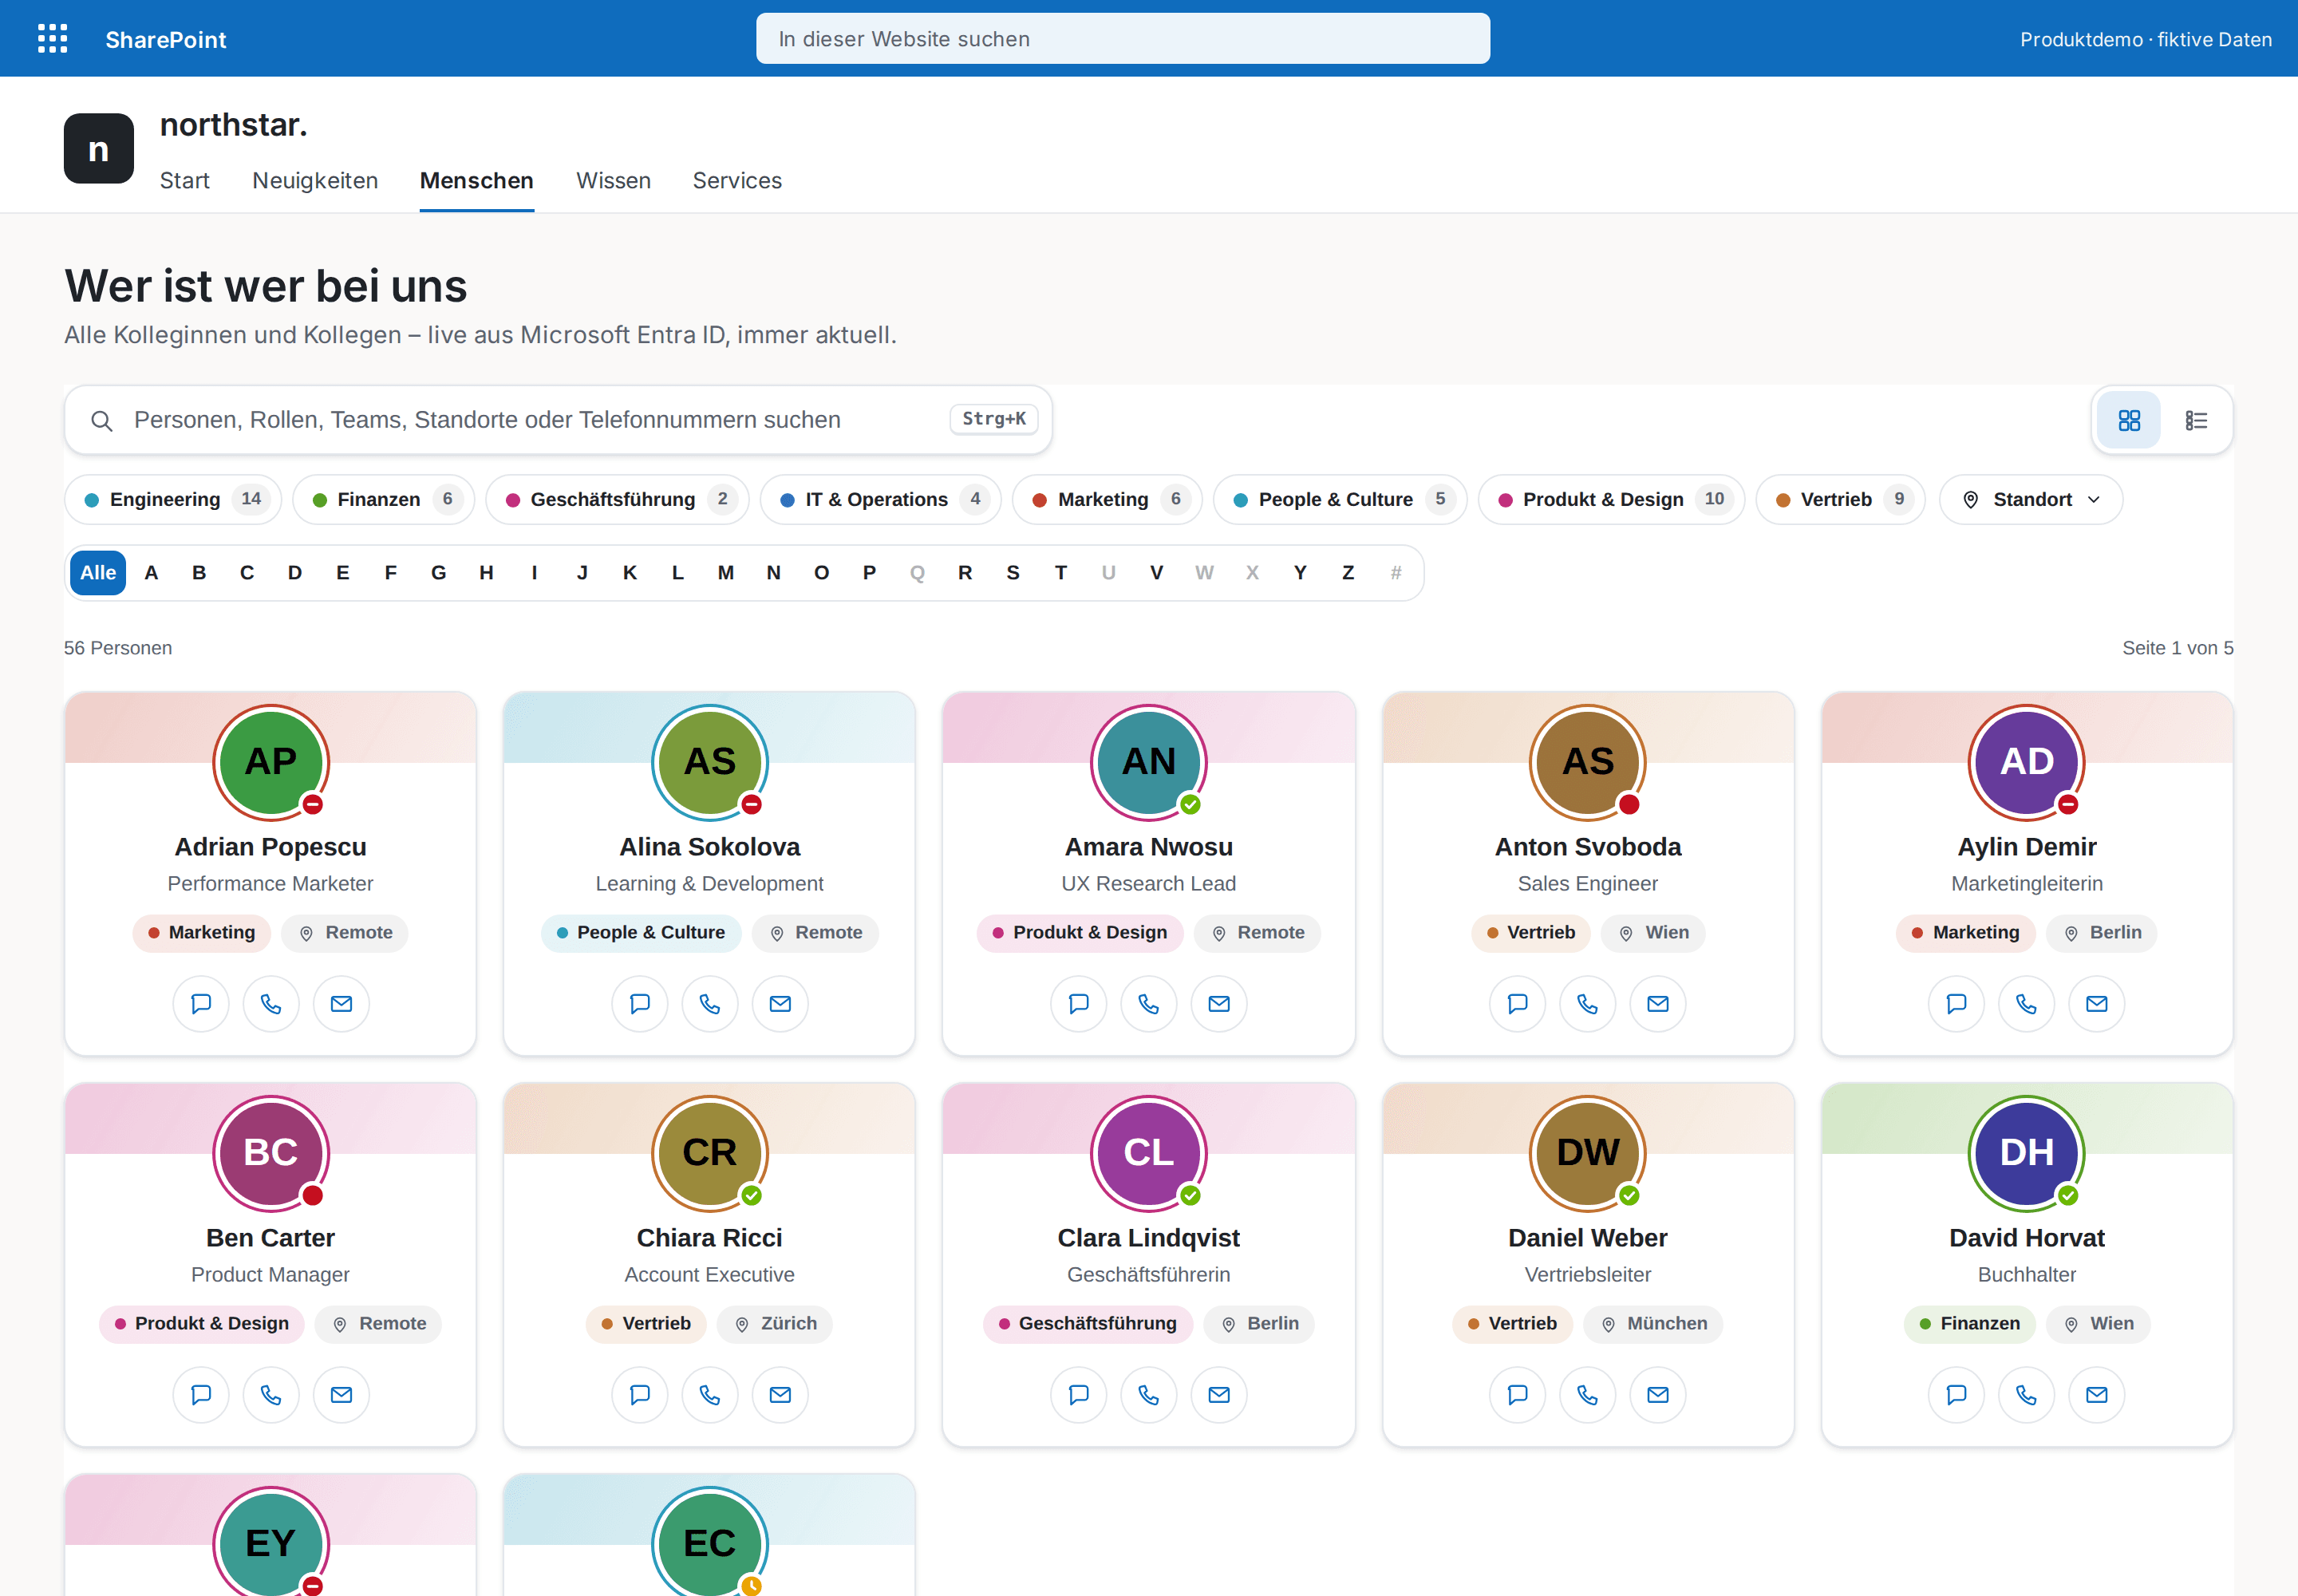
HR & People
The modern who's who for your intranet — every colleague one keystroke away.
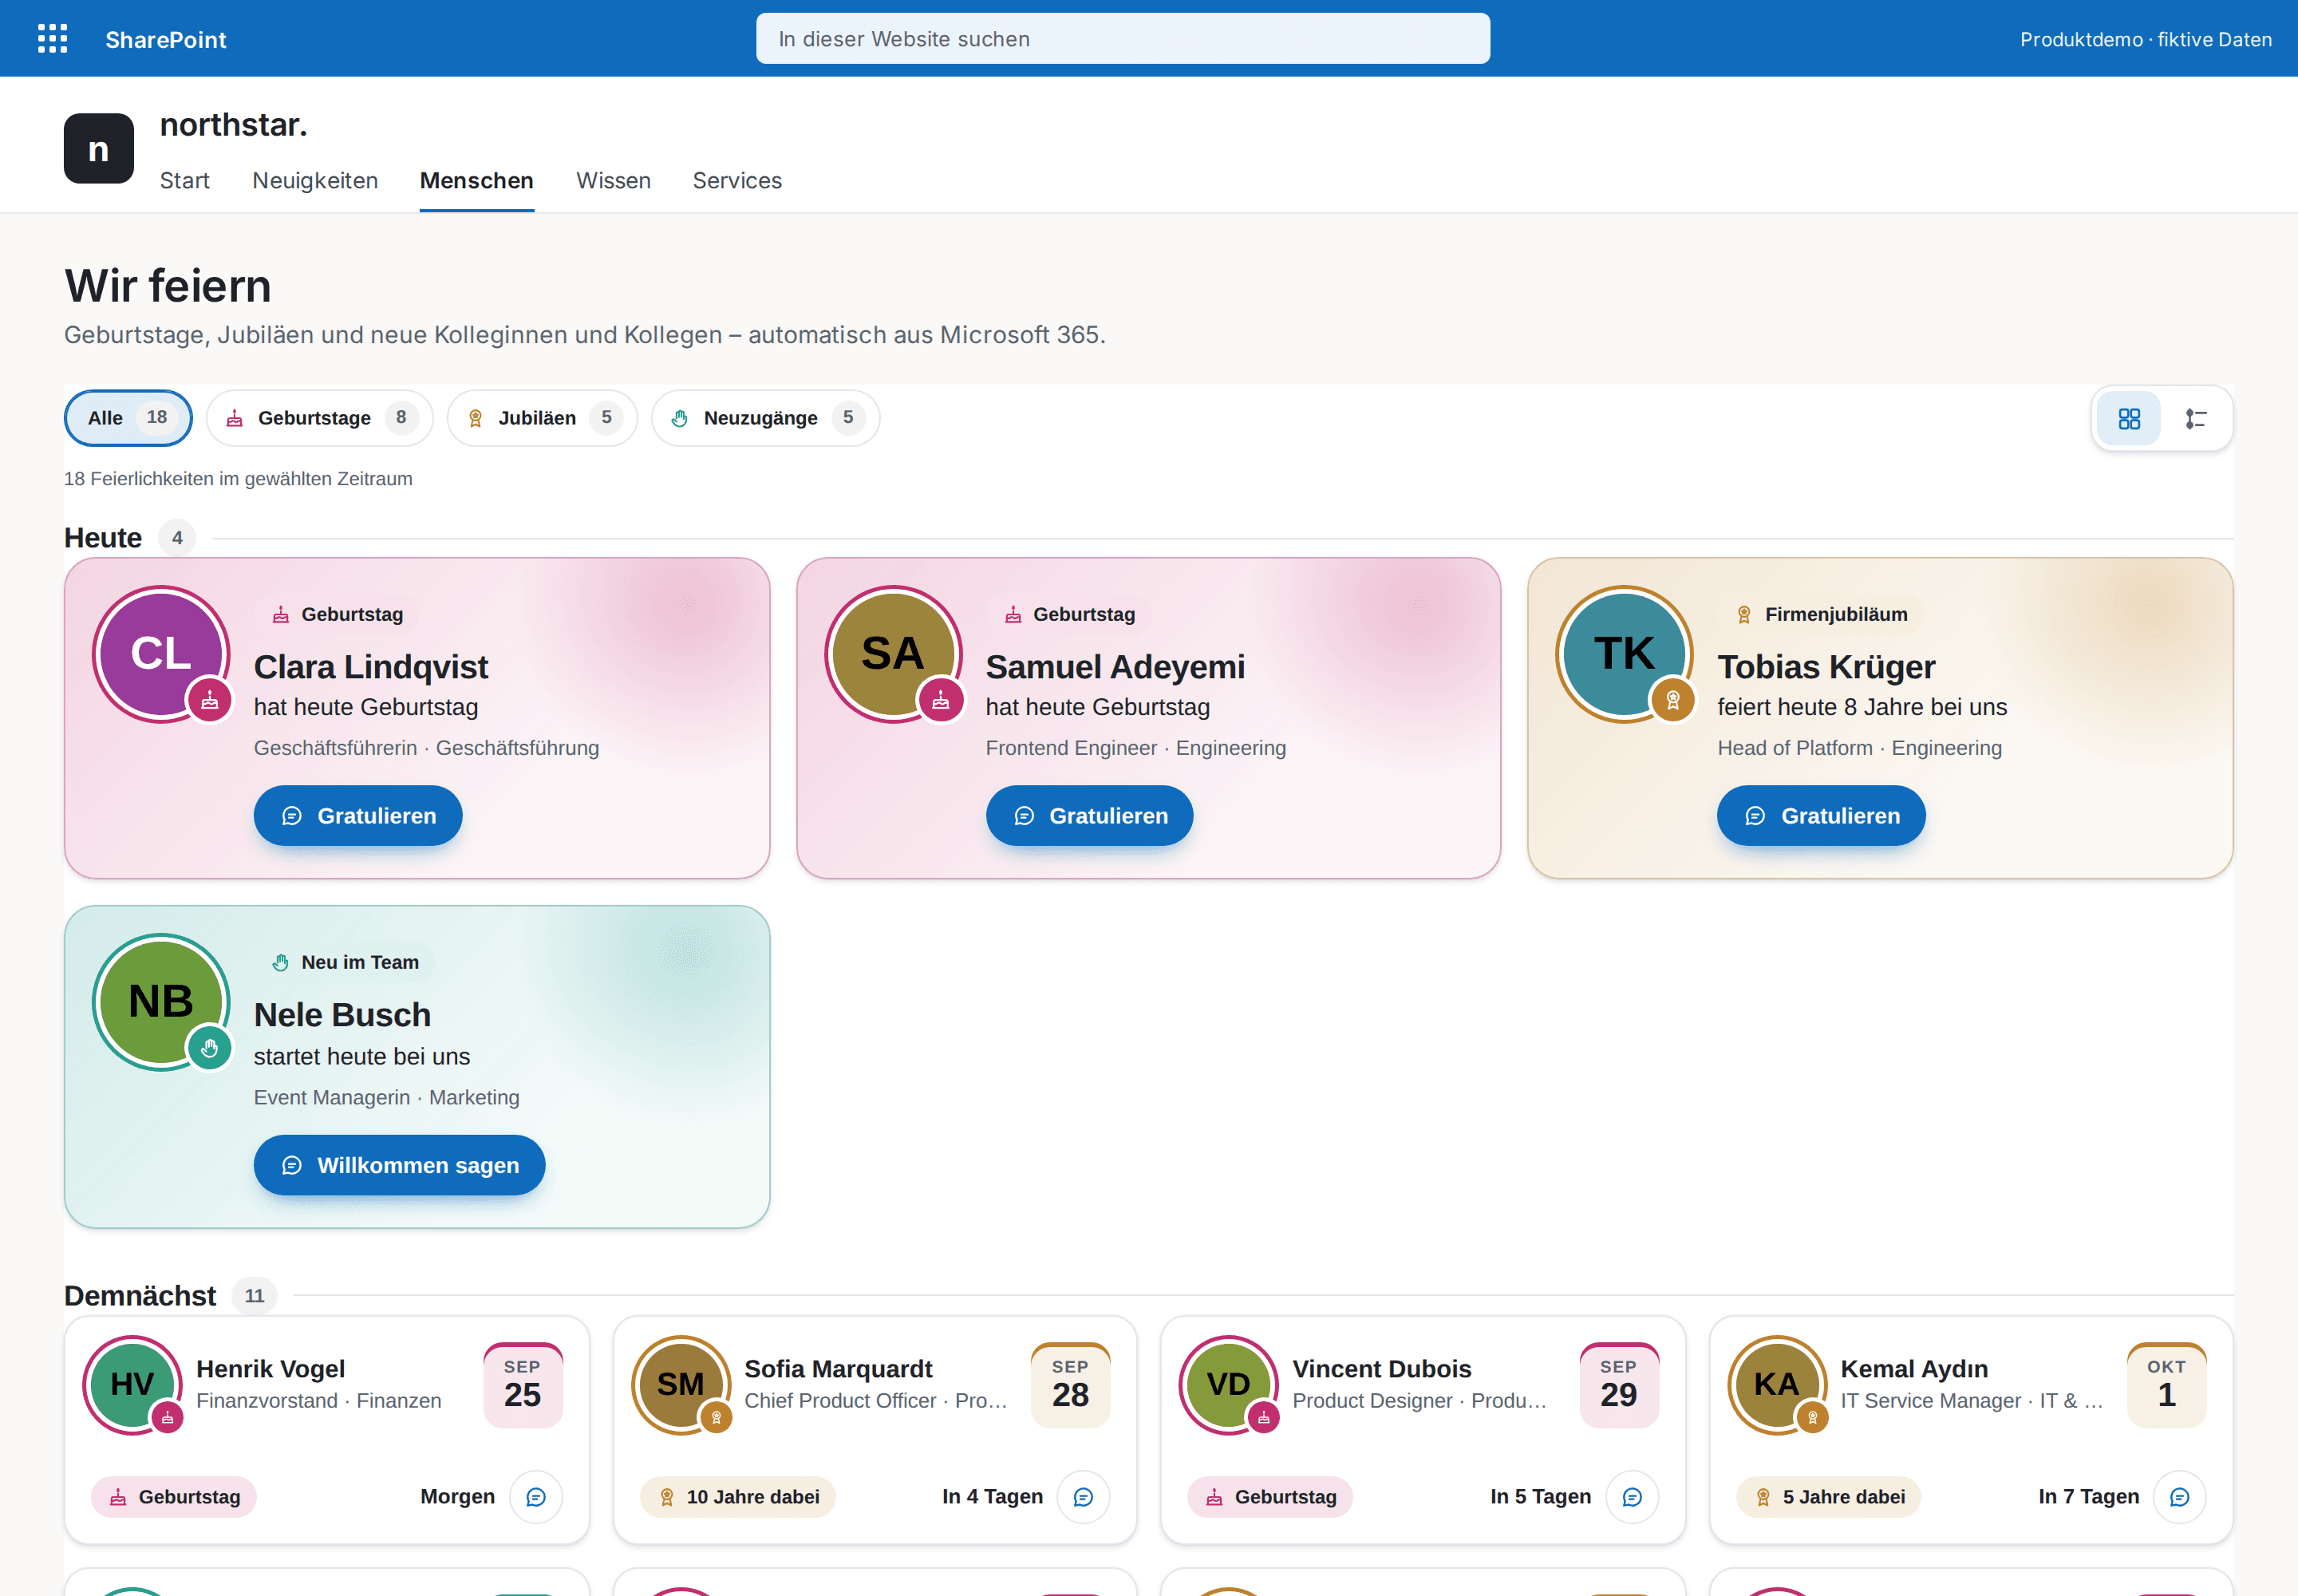
HR & People
Celebrate your people automatically — birthdays, work anniversaries and new colleagues, with congratulations in Teams.